I have written logmap for an collegue of mine. I wanted to
show him that the numerical computation of the limit cycles can be
speed-up and improved in quality by some kind of shooting method.
Function
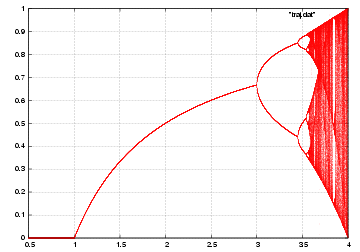
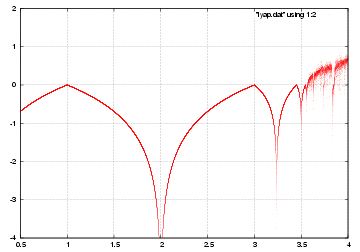
The program logmap computes the bifurcation diagram and the Lyapunov
exponents of the logistic map
with the bifurcation parameter
. Below you can see the graphs of the computed data.
Installation
To install the package you need a linux box, a gcc compiler, and
gnuplot.
Get the file logmap.tgz and extract it by
tar -xzvf logmap.tgz
The archive file logmap.tgz
extracts into a directory Logmap relative to the current
path. Change to that directory and call
make all
that should create the eps-files traj.eps and
lyap.eps with the bifurcation diagram and the graph of the
Lyapunov exponent versus λ. Both pictures are shown below.